
Monitoring Jobs
Last updated: June 1, 2022
Overview
This page walks you through how to use the Status tab to monitor the progress of your job and get information about your clusterA computing cluster consists of a set of loosely or tightly ... More in real-time.
You can view the tab by selecting Status on the left side of the screen when you run or open a job.
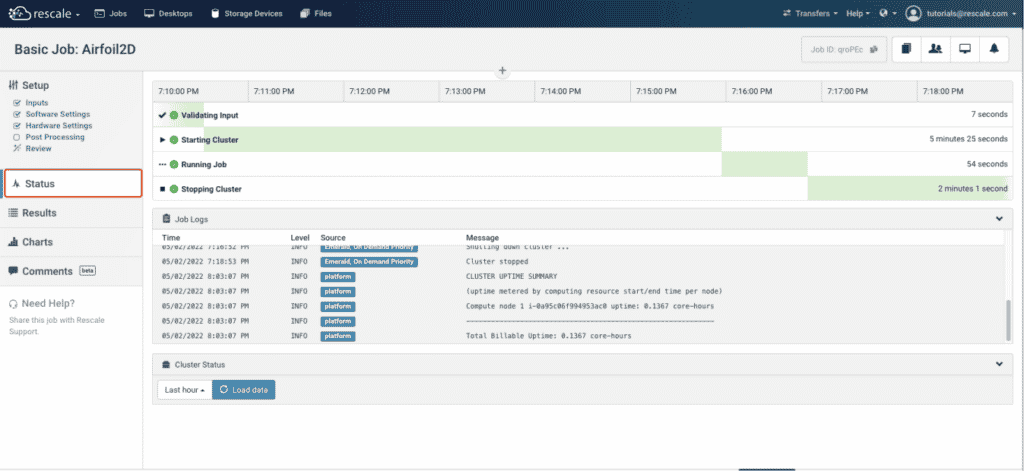
Job Status
As your job runs, it will go through five stages to successful completion shown: Queued, Validating Input, Starting Cluster, Running Job, and Stopping Cluster.
If an error occurs during any of these job states, a red X appears in place of the checkmark icon. Contact us if you encounter an error during one of these job states.
Job Logs
You can find additional status details in the job logs. An example of a typical log output is provided here:

For a job consisting of multiple runs (e.g., Design of Experiment or OptimizationOptimization is a systematic method to determine the values ... More), you will see when individual runs are started:

Cluster Status
The Cluster Status section gives you up-to-date information on the cluster that your job is running. If your job doesn’t run properly, or is taking an especially long time, this section includes monitors that may help diagnose potential issues.

For example, if your Avg Free Memory was especially low, it might indicate that the cluster did not have access to enough memory to meet the simulation’s requirements. If you are running on more than one nodeIn traditional computing, a node is an object on a network. ... More, you will see the status of each node on separate lines.
Live Tailing
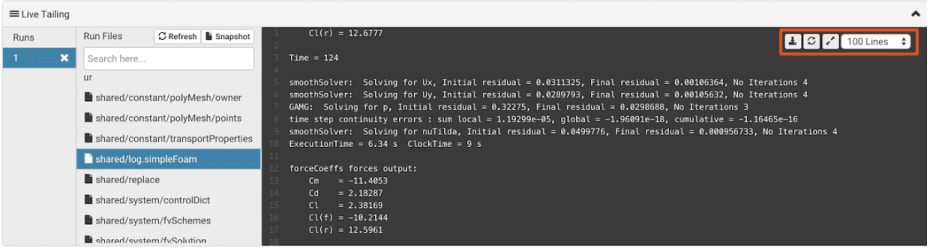
Live tailingalso referred to as real-time log monitoring or live log str... More allows you to monitor the progress of your simulationSimulation is experimentation, testing scenarios, and making... More in real-time and ensure the solution develops appropriately by following updates made to runtime files by the solverA solver is a numerical algorithm or a software tool that so... More. Select one of your cases from the list under the Active Runs table and click on any file associated with that case in the adjacent column to view the most recent lines of that selected file.
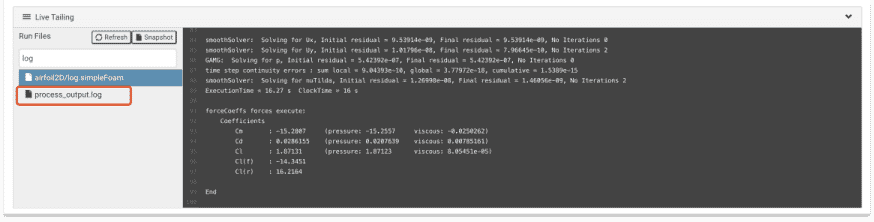
While the list of runs shown will vary as simulations start and stop, the list of files shown should be refreshed manually using the Refresh button to access the latest file contents. The live tailing feature is limited to files of 800KB or smaller.
Downloading files during runtime
If you place your mouse cursor in the Live Tailing window at runtime, you will see a number of options in the top right corner of the Live Tailing window, as shown below. The Download button on the left allows you to download this single file, as it is at the point in time when you issue this instruction.
If you want to download all the files for a run during its execution, follow the instructions given for Snapshots. The remaining buttons allow you to refresh the content of the file, expand the window to full-screen, and select the number of lines to be viewed.
Stopping an Individual Run or Complete Job
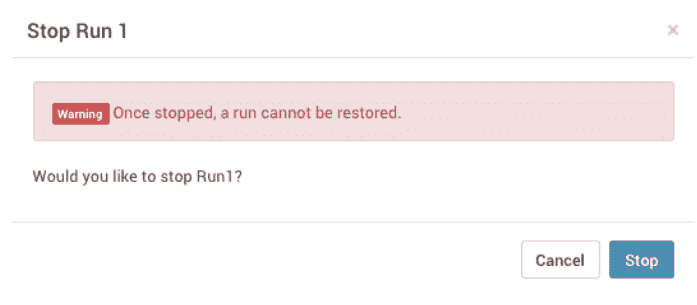
If you decide you want to stop an individual run in-progress, click the X next to the run number in the Runs column of the Active Runs table.

When you stop an individual job this way, you will see a dialog window, as shown below. If you choose Stop, your files for this run will be uploaded in the state that they were in when the Stop command was issued. This allows you to use them as input files for subsequent jobs.
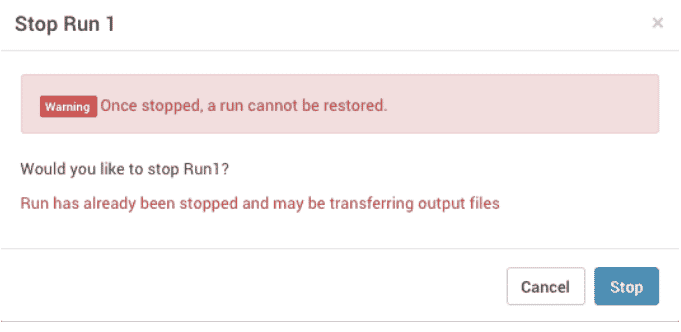
If the run you have chosen to stop has already completed its workflow, you may see the dialog shown below. In this case, it is safe to go ahead and click Stop on this dialog. Your files for this run will be uploaded.
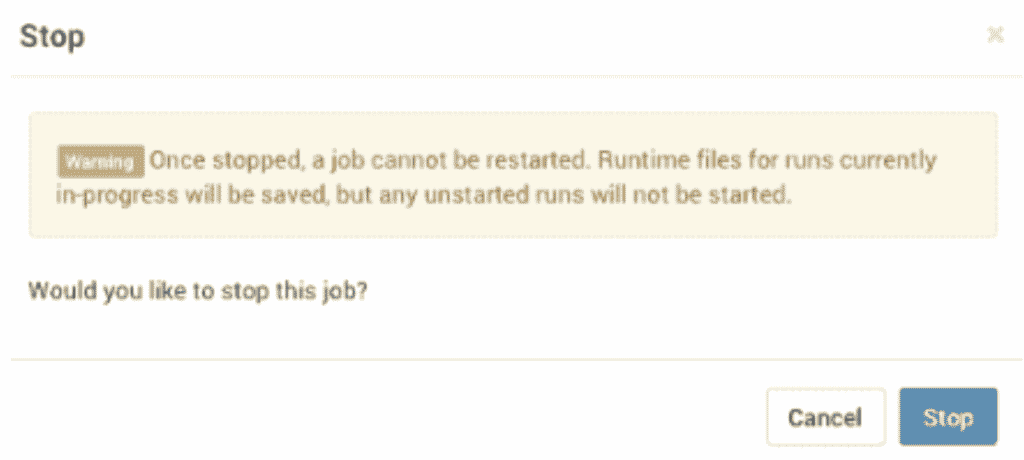
When you want to stop an entire job rather than an individual run, you can use the Stop button shown below. Your files for completed and partially completed runs within the job will be uploaded for you. Runs which have not yet started will not be launched.

If you use this Stop button to end your entire job, you will be presented with the following dialog:
Interrupting the job this way and shutting down the cluster is recorded in the job status output log as User requested… as shown below.

Next Steps
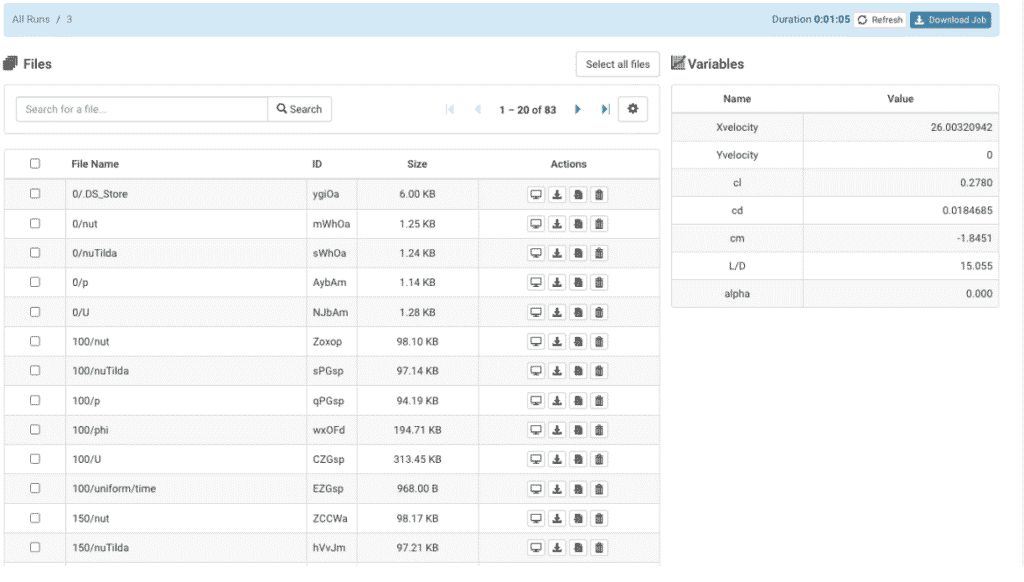
After the job completes and you have finished monitoring your status, the Results page opens with a list of generated files, such as log files, variables, visualizations, and graphs.
For more information about viewing and managing your job results, see the Managing your Job Results topic.